
Course contents
More
Your score
Project Management - Free Course with Quizzes
Get more done with project management
Project management is useful in a wide range of activities where structured planning, coordination, and execution are needed to achieve specific goals. Starting activities without planning often means a suboptimal result or redoing work, meaning extra time and costs.
 An analogy for this approach is packing your car when you go on vacation.
When items are packed when they arrive at the car, it often happens that a last-minute item, like a football, does not fit anymore.
Unpacking all items in front of the trunk and repacking often solves the problem.
An analogy for this approach is packing your car when you go on vacation.
When items are packed when they arrive at the car, it often happens that a last-minute item, like a football, does not fit anymore.
Unpacking all items in front of the trunk and repacking often solves the problem.
A more coordinated approach where all travelers put their items in front of the car before the packing starts, gives the possibility to plan what items are to be taken and how to fit them more densely.
A lot needs to be managed in a project, basically everything to make it a succes. The way to achieve this has been empirically found and is based on best practices. Some well-known frameworks are PMBOK, PRINCE2 and Scrum. Areas to manage are:
- Deliverables as part of the scope
- Create and track project planning
- Cost tracking
- Quality assurance and control
- Resource allocation
- Clear communication and status reporting
- Stakeholder expectations and concerns
Quiz
When could Project Management be MOST valuable?
Quiz
For what activity is Project Management LEAST beneficial?
Examples for improvement
Without proper Project Management a lot can go wrong on different aspects. Some results may look familiar to you. Click to see examples.
Quiz
What happens when a project has poor resource tracking?
Quiz
What is neglected when deliverables fail to meet standards?
Quiz
What causes team burnout and low morale?
Life cycle
A project's life starts with an idea and ends with a result. In order to progress from start to finish, a breakdown in manageable phases is recommended. Each phase has it own goal, meant to decrease uncertainty while work and costs increase.
A project life cycle typically consists of 5 phases, starting at Initiating and ending at Closing. Phases are not necessarily sequential in time. Executing and Monitoring & Controlling take place at the same time. For some projects also Planning can take place at the same time as Executing. In a cyclic type of project, phases are planned more agile, meaning that they can follow external demand; during phase 1 the next phase 2 is planned, etc.
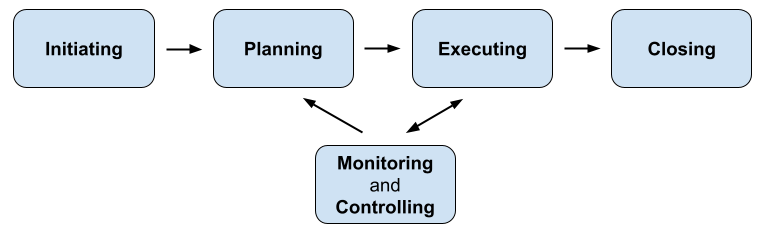
Phases differ per industry, company or even project. Standardization per industry or company helps to compare projects.
Phases
Click the following phases for typical activities.
Milestones
Phases are typically separated by milestones. Here a phase is closed by all stakeholders and the next phase is kicked-off in more detail than it was at the previous milestone.
Quiz
In what phase do you conduct a feasibility study?
Quiz
In what phase do you conduct Quality Assurance?
Quiz
In what phase do you report the status of the project?
Work Breakdown Structure
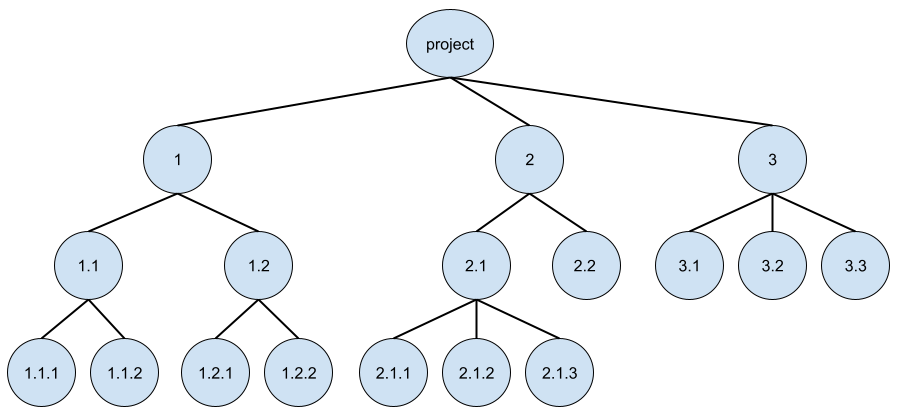
In general a Work Breakdown Structure (WBS) forms the basis for planning. It is a hierarchical decomposition of the work that needs to be done. It has a so-called tree structure with a root node (project scope) and branches to nodes that break down the scope into further details. An end node has no more breakdown nodes and is called a leaf.
In order to understand a node, you need to follow the entire path from root to node. The number of nodes in the path is the level of the node. With a WBS you make a breakdown from a complex deliverable to well-defined tasks. This systematic approach reduces the chance of overlooking relevant work.
WBS example
An easy way to visualize the WBS tree is to indent text. The hierarchical WBS code also shows the breakdown and level of a node. Click on a node to see the entire path.
The WBS codes form a tree:
Products and Activities
A project breakdown consists of products (nouns) and activities (verbs). The most strict division is using products for nodes and activities for end nodes. When you make a breakdown in tasks, you use nouns and verbs per node.
The contents of the breakdown can be collected from:
- Requirements documentation for deliverables
- Contracts with obligations
- Previous projects for lessons learned or collected data
- Company policies on projects
- Legal policies that apply for the product or service
- Brainstorm sessions with project team and experts using for instance a mindmap
Quiz
How many end nodes are in the WBS example?
Quiz
What WBS level has path /software/firmware?
Quiz
How many end-nodes in the WBS example are activities?
Resources
In order to execute a project, resources are required. There are many types of resources, most common is personnel that does the work. Personnel may require other resources like equipment, material, products, external services, etc. Resources have in common that they cost money and determine the project costs.
Resource types
Click on the resource type to see the definition:
See more about resource types in the user guide of ProjectWork.
Assignments
The amount of work is estimated per WBS activity and can be divided across the team members. The duration of activity work depends on the number of assigned team members and their availability percentages.
Personnel and equipment are priced per unit of time and the costs depend on the duration of an activity. Material and service are priced per unit and can be assigned to both products and activities, regardless of the time.
See more about resource assignments in the user guide of ProjectWork.
Capacity
Resources have limited capacity, meaning that their quantity is limited per unit of time. This is most clear for a person resource, who cannot work more than 100%. If a person needs to execute several activities simultaneously, this exceeds his capacity. Also other resources have a maximum capacity, like a skill group of 3 carpenters.
See more about capacity in the user guide of ProjectWork.
Quiz
Which statement about resources is correct?
Quiz
What contains a skill group?
Planning
In a schedule the project nodes, like phases, milestones, locations, deliverables and activities are arranged in time. The optimal start and finish dates of activities can be calculated based on their constraints. The start and finish dates of the lower level nodes in a path follow the higher level nodes. This will be explained with a visualization.
Gantt chart
A schedule can be made visible in a so-called Gantt chart, named after Henry Laurence Gantt who developed the chart around 1910. The chart contains the execution duration of the WBS nodes along a horizontal timeline as a bar, and the Work Breakdown along the vertical axis. The dependencies are indicated with arrows between the bars.
Dependencies
Activities in a Work Breakdown Structure may depend on each other in time. As an example, it makes sense to first develop a new function and than test it, rather than the other way around.
Dependencies can be described more general as one or more activities depend on one or more other activities. These dependencies turn the activities into a workflow. With complex dependencies you need to prevent loops in the workflow. As an example, in a Gantt chart dependencies look like this:
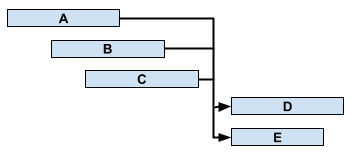
Activities D and E can only start when A, B and C are ready. Whether an activity is ready is made visible with a line in the centre of the Gantt bar. When the line has the same length as the bar, it is ready.
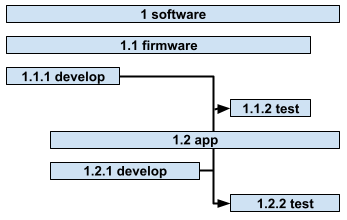
Do not confuse the work breakdown with the workflow. Nodes are part of the work breakdown and the workflow, but the breakdown is not part of the flow, see example in Gantt chart:
See more about dependency types in the user guide of ProjectWork.
Template
You can start a planning by copying a template. The advantage is that you do not need to create the WBS entirely yourself. Comparing projects from the same template is also easier.
Using a template is a good idea when it is a template that you made yourself from an existing project. You can include improvements, found while executing a project, to the template for future similar projects.
Taking a template from a gallery as a quick start has disadvantages. It may not contain all you need and making changes can take a lot of time. Making a WBS is teamwork and a gallery template is likely to distract or mislead.
Quiz
What is NOT a direct advantage of a Gantt chart?
Constraints
Constraints are the core of Project Management. The main constraints are scope, time and cost. The scope is what needs to be achieved within time and budget. List of constraints:
Solutions
Planning a project is in essence finding a schedule that fulfills all constraints. This complex calculation can be fulfilled with powerful Project Management software, like Microsoft Project and ProjectWork.
The Critical Path Method (CPM) solves the Dependencies and Deadlines constraints by first fulfilling the dependencies from project start to project finish and than backwards from finish to start. The nodes that have identical start and finish dates in both directions are on the so-called critical path, meaning that any delay for these nodes results in delay for the project.
Another method that includes the Resources constraint as well, is called Critical Chain Project Management (CCPM). It solves the human resource conflicts and makes explicit when human resources are available in buffers. If human resources are always available, then the Critical Chain is identical to the Critical Path.
In general, Resource Leveling solves the human resource constraints by shifting nodes. The result is that no human resource exceeds its capacity.
Uncertainty
A project is per definition a projection into the future, therefore the amount of work that is required to realize a Work Breakdown Structure is uncertain. The effect of this uncertainty on the project completion date is hard to analyse because of dependencies: nodes that follow each other will statistically counteract their variance, uncertainty in concurrent nodes can cancel out. In general the effect of uncertainty on the project completion date is overestimated because worst-case estimates are simply added.
Instead of analysis, a Monte-Carlo simulation can be used, named after the casino. In each calculation a random selection is taken from the uncertain work according to a probability distribution. Each calculation will result in a project completion date, which accumulate in a probability distribution. From this distribution, confidence levels on project completion dates can be derived. To avoid the time-consuming entry of a probability distribution and lengthy calculations, you can limit the entry to the most uncertain activities.
See more about uncertainty simulation in the user guide of ProjectWork.
Quiz
Under which constraint are legal standards listed?
Quiz
What statement is correct?
Monitoring
When a project is executed, monitoring is required to see if everything is going according to plan. If differences are noticed, control is required to make adjustments.
Progress
A simple and effective way of monitoring, is tracking the progress of all activities. With a long and complex activity, estimating its progress is difficult and ticking off completion happens late. When you split a long activity into several, more concise activities, delays are noticed sooner.
The progress of a node follows the progress of its higher level nodes. Since end-nodes do not have higher level nodes, their progress can be entered.
Risk
Uncertain events may require a plan to be revised. Therefore it is required to identify and register risks upfront. Risks which you identify are more likely to be avoided and when they occur the response is already known.
A risk can be quantified by multiplying its likelihood and its impact in time, money or other category. All risks can be calculated in a matrix so you can find the highest rated that require an action plan.
Baseline
When the project planning is adjusted, remembering where you come from is beneficial. This can be achieved by setting a baseline of the planning before you adjust it.
Having a baseline also helps to predict the delay in project completion, based on the Earned Value Method (EVM). This method creates a curve from project start to project finish on the horizontal axis and the accumulated amount of work vertically. Typically an S-shaped curve appears.
See more about baselines in the user guide of ProjectWork.
Quiz
Which statement is correct?
Quiz
What is NOT correct?
Feedback
If you have any questions or feedback about this course, please let us know!
Please contact the helpdesk.