

Page contents

User guide ProjectWork
Layout
Panels
ProjectWork online project management software shows all project information from left to right in separate panels. Each panel has its own menu. Panels can be hidden to give other panels more space.
panels : Capacity | Resources | ProjectWork | Tasks | Gantt
- The Capacity panel contains a bar chart showing the allocation of resources over time.
- The Resources panel contains a table with the resources of the project.
- The ProjectWork panel contains project and account information.
- The Tasks panel contains a table with the tasks of the project.
- The Gantt panel contains a bar chart showing the tasks over time.
The ProjectWork panel is the central panel that permanently contains the file name and storage information and alternately a default dialog or the dialog of a selected function or detailed information of a selected task or resource.
Permanent information:
- When the file name is clicked, the Project properties dialog replaces the default dialog. Here you can view and change file and project properties. After closing this dialog the default dialog returns.
- Beneath the file name is room for a status message regarding automatic and manual storage in Google Drive.
- When you make a change to the view, like expand/collapse, a message to save the view appears. If you click the message, the view is saved in the schedule file and the view synchronizes to all active sharing users.
Default dialog contents:
- Your Google account and the option to sign out. When you click on the account, a new tab opens with ProjectWork consent kept with Google.
- Your trial or license status. You can purchase a license with PayPal or activate your group license.
- Frequently used functions.
- The option to mark cells and rows that change when you or someone else make a change in the schedule.
- Help like manual, videos and helpdesk, built-in tooltip quick tour and assistance dialog.
Detailed information of selected task or resource:
- Task/resource assignments are visible across the panels when you click either of them. The selected task or resource details are in the ProjectWork panel, including the assigned quantities.
- When no task or resource is selected anymore, the default dialog returns.
Edit schedule
The Tasks and Resources tables can be edited per cell by clicking the cell. An outline appears around the cell and the row gets selected. The text can now be entered.
The Enter key advances the selection to the cell below, the Shift + Enter to the cell above.
The Tab key advances the selection to the cell on the right, Shift + Tab to the cell on the left.
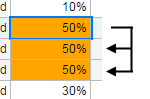
Copying a cell to multiple cells with the same text at once starts by selecting a cell with the left mouse key followed by selecting this cell and adjacent cells above or below with the Shift key pressed. After releasing the mouse the cells get the same text as the first selected cell, see example below.
With copy (Ctrl + C) and paste (Ctrl + V) you can copy text quickly from a spreadsheet or document into ProjectWork. Multiple cells from a column of the spreadsheet or multiple rows of text from the document will paste in a ProjectWork column in subsequent rows. When copying for new tasks, start with the Task description column. When copying dates, make sure that the date format setting in ProjectWork matches the date format of what you copy.
When a single task/resource row is selected a task/resource dialog appears to see and edit the details. Hidden columns are also visible here. Next to the dialog the quantity column shows the assigned quantity which can be edited as well.
Select rows
Some menu items work in combination with one or more selected rows in the Tasks or Resources table. If no row is selected, these items are grayed out and cannot be used. Selected rows have a dark background color.
Rows can be selected by selecting a row and with left mouse key pressed selecting neighboring rows.
Another way of selecting consecutive rows is by selecting the first row and with Shift pressed the last row.
De-selecting is done with the ESC key.
Arrange columns
The width of a column can be resized by dragging the border in the column header. By clicking the border, the column width will automatically adjust to its contents. The width of the columns can be saved manually.
Further adjustment is done from a dialog. This dialog is opened from the ProjectWork Tasks menu or the ProjectWork Resources menu. It can also be opened by clicking on the Tasks or Resources table header.
A checked column in the dialog is visible in the table. The order of the columns can be re-arranged by dragging and dropping them at the requested position. The view of the columns can be saved manually.
You can add one custom column at a time by giving it a Title and Type and clicking Apply. The column appears last in the table and can be repositioned by dragging it to the requested position. A custom column can be removed by deleting its title and clicking Apply.
Keyboard shortcuts
Keyboard and mouse can perform some functions directly, see list.
Mac: ⌘-command key instead of Ctrl.
| Ctrl + Mouse click |
Link or unlink selected task(s) with the clicked task
Assign selected resource(s) to clicked task |
| Ctrl + Scroll wheel | Zoom in/out in Gantt and Capacity chart |
| Shift + Scroll wheel | Horizontal scroll in panel |
|
Right mouse click
Mac: Ctrl + Mouse click |
Context menu |
| Esc | Deselect and close dialogs |
| Tab | Next cell |
| Shift + Tab | Previous cell |
| Enter | Next row |
| Shift + Enter | Previous row |
| Shift + Mouse click | Select rows between selected row and clicked row |
| Shift + Mouse pressed | Copy content of selected cell to cells below/above |
| Ctrl + L | Reload project |
| Ctrl + Z | Undo |
| Ctrl + Y | Redo |
| Ctrl + C | Copy row(s) |
| Ctrl + X | Cut row(s) |
| Ctrl + V | Paste row(s) |
| Ctrl + U | Insert row(s) above |
| Ctrl + D | Insert row(s) below |
| Ctrl + E | Erase row(s) |
| Ins | Insert row(s) above |
| Del | Delete row(s) |
| Ctrl + > | Indent row(s) more |
| Ctrl + < | Indent row(s) less |
| Ctrl + ? | Show keyboard shortcuts |
| mouse click on headers | Arrange columns |
Context menu
The context menu appears by first selecting one or more rows and then right mouse-click (Mac: Ctrl + Mouse click) the rows. The selected function affects the selected row(s).
Project
Dropdown menu
New project
Starts a new project with an adjustable title. The file is put in Google Drive in the same folder(s) as the original. Sharing permissions are not copied from the original file, but they are copied from the common folder(s).
Open project...
Shows a list from Google Drive with previously saved ProjectWork files. Opens the selected file.
Make a copy...
Opens a dialog to copy the schedule to a new file which opens in a new browser tab. The name can be changed in the copy afterwards.
The copying has options, that are enabled if the data is present:
- copy also the published spreadsheet
and link it to the copy, keeping the layout of the original,
- keep the copy linked to the same dashboard spreadsheet
as the original,
- copy the saved clipboard tasks in the schedule,
- copy the baselines in the schedule.
Overwrite file...
Opens a list from Google Drive with previously saved ProjectWork files. Overwrites the selected file with current project.
Google Drive
Opens new tab with Google Drive.
Share file...
Opens Google Drive dialog to share file with others for editing or viewing. They can open to file in their Google Drive in folder Shared with me and edit or view the schedule in ProjectWork depending on how the file is shared. Edits are processed real-time to all shared schedules which are open, allowing for simultaneous collaboration.
Import > Microsoft Project XML file...
Loads an MS Project XML-file from the PC and converts it to a ProjectWork schedule. After the conversion, a link appears that opens the planning in a new tab.
Import > ProjectWork schedule from PC...
Loads a JSON file with ProjectWork schedule from the PC. After the loading, a link appears that opens the planning in a new tab.
Import > mindmap from PC...
Loads a JSON file created with MindMup from the PC and converts it to a ProjectWork schedule.
See From idea to schedule with mindmap for more details.
After the conversion, a link appears that opens the planning in a new tab.
Uncertainty simulation...
Opens a dialog to perform a simulation where tasks can have a minimum and maximum duration.
The result is shown as confidence levels for the project finish data.
See Uncertainty simulation for more details.
Project properties...
Opens a dialog with properties of the current project.
Post chat message...
Opens a popup dialog to post a message in a Google Chat space or Slack channel.
See Post chat message for more details.
Publish > schedule as HTML
Opens a dialog to publish the displayed schedule as HTML in the browser as a preview or as code.
You can copy the code or save it to a new Google Drive file or overwrite an existing file.
See Publish schedule as HTML for more details.
Publish > schedule in Google Sheets
Opens a dialog to publish the schedule tasks and resources to a new or existing Google spreadsheet.
See Publish schedule in Google Sheets for more details.
Publish > milestones in Google Calendar
Opens a dialog to create, update and remove milestones in Google Calendar.
See Publish milestones in Google Calendar for more details.
Publish > sites in Google Maps
Opens a dialog to publish all Resources with Site filled-in in a .html file in Google Drive.
This file can be viewed from Google Drive in Google Maps.
See Publish sites in Google Maps for more details.
Export > ProjectWork schedule to PC
Saves a ProjectWork schedule in a JSON file on the PC.
Export > Microsoft Project XML file
Exports the ProjectWork as MS Project XML-file to the PC.
Baselines...
Opens a dialog to set, show and compare baselines.
Report > project status...
Opens an HTML document with progress information on work hours. Includes the latest baseline if set as a reference.
Report > project inspection...
Opens an HTML document with information on how tasks and resources are assigned.
Report > dashboard...
Opens a dialog to add the project to a new or a selected dashboard or to update the project in the selected dashboard. See Report in dashboard for more details.
Prints the tasks table and the Gantt chart via the browser as you see them. Adjust the mutual width of the panels and other viewing preferences, like hiding columns and collapsing tasks, before you print them. In Chrome print preview you can adjust the scale so that the entire planning is printed, possibly over several pages. In some browsers you can print to a PDF file.
New resource manager
Opens a new browser tab called ProjectWork-Resources.
In this version of ProjectWork a resource manager can share its resources with multiple projects.
Per project he can see to which tasks his resources are assigned to.
Use Reload to see the last status since the schedule was opened.
See also Resource Management using ProjectWork.
Shared resources...
Shows which resource managers share resources with this project. The shared resources are grouped in the Resources sheet.
Reload
Reloads the schedule to show any changes in the shared resources since the schedule was opened.
Settings...
Opens a dialog with settings.
Working hours...
Opens a dialog to adjust the working hours for the project.
Non-working periods...
Opens a dialog to add or delete non-working periods to the project. A non-working period has a start date and a finish date. During the period the project is not executed for all resources and the schedule delays.
In-app purchase
After registration and selecting license type and period you can purchase the license with PayPal.
Manual
Opens this manual in new tab.
Helpdesk...
Opens contact form.
Adjust working hours
This function dialog is opened from the ProjectWork menu.
A day can have 5 non-overlapping working periods. Default working hours: Monday - Friday (5 days) from 08:00 AM - 12:00 PM and 01:00 PM - 05:00 PM (2 periods). This accounts for 8 hours per day and 40 hours per week. Other examples of periods are in the table below for both AM/PM time display and the corresponding 24 hour display.
| AM/PM | 24 hour | duration | ||||||
|---|---|---|---|---|---|---|---|---|
| 08:00 AM | - | 12:00 PM | 08:00 | - | 12:00 | 4h | ||
| 01:00 PM | - | 05:00 PM | 13:00 | - | 17:00 | 4h | ||
| 12:00 PM | - | midnight | 12:00 | - | 24:00 | 12h | ||
| 12:00 AM | - | midnight | 00:00 | - | 24:00 | 24h | ||
Change working periods by entering the new period times, ticking the period(s) you like to change and clicking Apply.
Add working periods by setting the start and finish time of a period, ticking 'new period' on the day(s) where you like to add the period and clicking Apply.
Remove working periods by leaving the period times empty, ticking the period(s) you like to remove and clicking Apply.
Compare schedule with baseline
This function dialog is opened from the ProjectWork menu.
When you set a baseline, you make a copy of the schedule. The baseline is listed with the name you gave it together with the date and time it was made. Subsequent baselines follow in the list. You can permanently remove a baseline by deleting its name in the list and pressing the Apply button.
You can then select the baseline(s) you want to show. If selected, a baseline is shown below a task and resource in their tables, when the baseline corresponds.
You can compare a baseline with the schedule, using its value or the variance between baseline and schedule, also as a percentage.
Uncertainty simulation
This function dialog is opened from the ProjectWork menu.
The simulation of uncertainty in a project schedule involves estimates of task durations to calculate the project completion date. This is not simply using the minimum and the maximum estimates, because tasks counteract depending on the project flow. Probability and repetition are used to get a distribution of the project and tasks finish dates. Because it resembles a casino, it is also called a Monte Carlo simulation.
The probability distribution of the task duration follows a triangle, where the default duration forms the top and the minimum and maximum durations the zero probability end points. Each non-summary task has the possibility for a minimum and maximum duration. The simulation consists of runs in which for each task randomly a duration is selected. After each simulation run, the calculated end date and presence on the critical path are collected per task.
After the simulation each task has the finish date distribution in its details dialog and the project summary task also in this function dialog. The finish date confidence levels are presented in a table from 10 to 100%. The confidence in finish dates can be made visible in the Gantt chart for 20%-50%-80%. The sensitivity column is in the Tasks table indicating the percentage of runs a task is on the critical path.
Starting a new simulation will delete the previous one. You can choose to include resource leveling in the simulation. The simulation does not adjust the schedule based on the default task duration. The minimum and maximum task duration are only taken into account for the confidence levels of the end date. This allows you to communicate a realistic end date and still keep the original schedule.
Tasks
Tasks are the basis of the project schedule. They are the rows in a table with columns that contain properties of the tasks. They can be organized in a hierarchical breakdown structure with summary tasks.
The table can be shifted with the scroll bar at the the bottom or by "grabbing" the header with the mouse.
Coming to a complete schedule of tasks is best achieved in following steps:
- Work Breakdown structure - the subdivision of an entire project into products and activities
- Task order - the order in which tasks are depending on each other by linking them
- Phases - groups of tasks that have a specific function like design, construction, delivery
- Milestones - important decision moments concluding phases (in ProjectWork a task with duration 0)
- Resources - people and means to complete the task
- Work - the hours needed to complete a task
- Start date - results with work, resources and available working hours in a finish date per task
- Critical path - the linked tasks that result in the shortest project finish date
- Documentation - information on design and progress
Table columns
Each task has the following fields with information, see also Arrange columns.
ID
Sequence number that is referenced when linking tasks.
WBS
Dot-separated code that indicates per level where the task fits in the Work Breakdown Structure of products and activities. An example is 4.1.2 consisting of 3 levels.
Task description
Description of the task based on the product and/or activity needed to be delivered. In the details panel you can highlight a task description with a background color.
Minimum Duration
This column is default hidden and part of Uncertainty simulation. It is an optimistic estimate of the task duration. The duration needs to be less than Duration. No estimate means equal to Duration.
Duration
The time a task takes in days (d) and hours (h), for example '2d 4h' corresponds to 20 hours. A duration without units is in days. A duration of 0 turns a task into a milestone.
Maximum Duration
This column is default hidden and part of Uncertainty simulation. It is a pessimistic estimate of the task duration. The duration needs to be more than Duration. No estimate means equal to Duration.
Sensitivity
The percentage of the simulation runs that this task is on the critical path.
This column is default hidden and part of Uncertainty simulation.
Start date
Starting date and time of the task, according format from settings. Click to use the pop-up calendar to pick a date or enter date and/or time directly. Fast date entry is possible by skipping month and year giving the first date from today.
Finish date
Finishing date and time of the task, according format from settings. Click to use the pop-up calendar to pick a date or enter date and/or time directly. Fast date entry is possible by skipping month and year giving the first date from today or start date.
Progress
Percentage indicating the completion of the task. In combination with progress indication at Settings the progress results in a color.
| condition | color |
| today before task start date | no color |
| today after task start date and progress on schedule | green |
| today after task start date and progress behind schedule | yellow |
| today after finish date and progress less than 100% | red |
| progress equals 100% | no color |
Predecessors
The ID's of preceding tasks, see Link dependencies.
Condition
In addition to Predecessors and Duration, the scheduling algorithm also considers a Condition. Without a Condition, the option is ASAP.
| Option | Meaning |
| (ASAP) | As Soon As Possible |
| ALAP | As Late As Possible |
| Start on | start on the Start date |
| Finish on | end on the Finish date |
The Start on and Finish on options are automatically selected when you enter a Start date or Finish date. The date remains visible below the Condition option in the details panel. If the Start or Finish date deviates from this date, this will be displayed as a warning with a red background color.
Slack
The time a task can start later before becoming part of the critical path. The time is in days (d) and hours (h), for example '2d 4h' corresponds to 20 hours.
Resources
The abbreviation or name of assigned resources, see Assign resources to a task.
Work
The total number of hours the assigned resources work to this task.
Cost
Cost per task or the total cost of the assigned resources.
Constant
Columns Resources, Work and Duration relate according: Work = Resources x Duration
Resources is the sum of the Resources of type Work: 3 for R1;R2[2]
When changing a column, one of the other two columns will change its value,
depending on the Constant setting according to the table below.
| constant | change | calculated change |
| Resources | Resources Work Duration |
Work = Resources x Duration Duration = Work / Resources Work = Resources x Duration |
| Work | Resources Work Duration |
Duration = Work / Resources Duration = Work / Resources Resources = Work / Duration |
| Duration | Resources Work Duration |
Work = Resources x Duration Resources = Work / Duration Work = Resources x Duration |
You can select the default setting for new tasks in Settings > Default constant.
Custom columns
Additional columns.
Dropdown menu
The tasks menu is at the top of the tasks panel and opens when clicked with the functions below.
Collapse
Collapses the selected summary tasks. If you want to keep and share this view, save it manually.
Expand
Expands the selected summary tasks. If you want to keep and share this view, save it manually.
Collapse level
Collapses all summary tasks with a WBS level equal to the selected task. If you want to keep and share this view, save it manually.
Collapse all
Collapses all summary tasks. If you want to keep and share this view, save it manually.
Show all tasks
Expands all summary tasks and shows all hidden tasks. If you want to keep and share this view, save it manually.
WBS and linked tasks
Shows selected task and all its preceding and succeeding tasks, including their summary tasks, if any. If you want to keep and share this view, save it manually.
Filter > critical path
Shows the tasks on the critical path. If you want to keep and share this view, save it manually.
Filter > unfinished tasks
Shows the tasks which are not 100% completed. If you want to keep and share this view, save it manually.
Filter > colored tasks
Shows the tasks which have a background color as highlight. If you want to keep and share this view, save it manually.
Filter > visible in Gantt chart
Shows only the tasks that are (partially) visible during the set timescale of the Gantt chart. If you want to keep and share this view, save it manually.
Sort down > on selected column
Sorts selected tasks downwards based on selected column.
Sort up > on selected column
Sorts selected tasks upwards based on selected column.
Increase indent
Increases the WBS level of the selected tasks if possible, e.g. 1.2 becomes 1.1.4.
Decrease indent
Decreases the WBS level of the selected tasks if possible, e.g. 1.3.1 becomes 1.4.
Insert summary above
Inserts a summary task above the selected tasks and increases the WBS level of the selected tasks. Adjust the name of the inserted summary as desired.
Insert rows above
Inserts above the selected rows as many empty rows as selected.
Insert rows below
Inserts below the selected rows as many empty rows as selected.
Erase rows
Erases the selected rows.
Delete rows
Deletes the selected rows.
Copy rows
Copies the selected row(s) onto the clipboard for further pasting.
Cut rows
Copies the selected rows onto the clipboard and then deletes them.
Paste rows
Inserts the clipboard at the selected row.
Paste options...
Opens a dialog to select what information to paste from the clipboard:
- per task any added color, note, documents in Google Drive,
resources and links,
- custom columns from other schedule,
- how many times to repeat the clipboard (default is 1),
- how much to multiply the task duration (default is 1.0).
Save clipboard...
Opens a popup dialog, see Save tasks on clipboard.
Undo
Undoes the last change.
Redo
Redoes the last change.
Clear leveling selection
Clears all shifts of the selected task(s) due to assignment leveling.
Chain
Links the selected tasks sequentially.
Remove links
Removes all links from the selected tasks.
Columns...
Opens a dialog, see Arrange columns.
Link dependencies
Tasks may depend on each other for their execution order. This can be indicated with dependencies between tasks by referring to the IDs of the predecessors in the task column Predecessors. There are different types of dependency, which are placed behind the ID, see table below.
| Type | Link | Dependency |
| FS | Finish to Start | The successor can only start when the predecessor finishes.
This is the default dependency if the type is absent. |
| SS | Start to Start | The successor can only start when the predecessor starts. |
| FF | Finish to Finish | The successor can only finish when the predecessor finishes. |
| SF | Start to Finish | The successor can only finish when the predecessor starts. |
Tasks can be linked with the control key (Mac: meta key) and mouse click. Select the rows of one or more predecessors and then with Ctrl + Mouse click the successor. The predecessor(s) are linked with their ID in the Predecessors column at the successor. The link type is absent and FS by default, but another type can be added. Unlinking is done in the same way as linking, an existing link will be removed.
Each dependency can be adjusted by adding lag or lead time. Lag time introduces delay between the linked tasks, lead time introduces overlap between linked tasks. The lag/lead time is put after the dependency, where positive time is lag and negative time is lead.
Examples of dependencies:
| 3SS | single Start to Start dependency with task ID 3 |
| 3SS;4 | double dependency with tasks 3 and 4 |
| 3SS;4+1d | lag time of 1 day with task 4 |
| 3SS;4-1d | lead time of 1 day with task 4 |
Save tasks on clipboard
The clipboard is used to temporarily copy and paste tasks from and to all your schedules. Tasks on the clipboard can be saved and copied back to the clipboard later to be pasted into the schedule. The paste options determine the information to be pasted from the clipboard and the applied repetition and duration.
The contents of saved tasks cannot be edited afterwards. Saved tasks can be deleted after expanding them first. The order of multiple saved tasks can be changed into a logical order by dragging them. Both changes can be undone with Ctrl + Z.
The saved tasks can be copied as part of a schedule to a new schedule, ProjectWork dropdown menu > Make a copy... select option > include saved clipboard tasks. This allows the creation of a template schedule containing groups of tasks to be used by copied schedules as building blocks.
Gantt chart
The Gantt chart shows the schedule per task as a bar. The position of the bar depends on the timescale at the top. The timescale can zoom-in (+) and zoom-out (-) and the start date can be adjusted in a calendar.
When zoomed in, the Gantt chart can be shifted with the scroll bar at the bottom. As an alternative the timescale can be shifted by "grabbing" with the mouse. With the mouse in the timescale, the left mouse button zooms-in and the right mouse button zooms-out.
Gantt dropdown menu
The Gantt menu is at the top of the Gantt panel and opens when clicked with the functions below.
Selected tasks
Sets the timescale of the Gantt chart to match the earliest start date
and the latest finish date of the selected task(s).
Tip: Select a summary task to see all its subtasks.
Today
Sets the start date of the Gantt-chart equal to today.
Project start
Sets the start date of the Gantt-chart equal to the project start.
Entire project
Shows the project from start to finish date.
Autofit
Sets the timescale to fit all visible expanded tasks.
Scale as Capacity chart
Makes the Gantt scale equal to the Capacity scale.
To Capacity chart
Changes panel view to show Capacity chart.
To Capacity with scale as Gantt
Changes panel view to show Capacity chart with scale equal to Gantt chart.
Resources
Resources are the people and the means necessary to perform a task. They are the rows in a table with columns that contain properties of the resources. They can be grouped into teams or clusters that summarize their properties.
The table can be shifted with the scroll bar at the the bottom or by "grabbing" the header with the mouse.
Table columns
Each resource has the following fields with information, see also Arrange columns.
ID
Sequence number
RBS
Dot-separated code that indicates per level where the resource fits in the Resource Breakdown Structure of teams and clusters. An example is 4.1.2 consisting of 3 levels.
Abbr
Abbreviation of this resource. If present, this abbreviation is used in column Resources in the Task table.
Resource name
Name of the person or description of the resource.
Type
List with possible resource types.
Unit
Per hour, per piece, per meter, etc.
Progress
Percentage indicating the completion by the resource.
Capacity
Maximum quantity of a resource above which the resource diagram shows red.
Also the quantity that is assigned to a task with Ctrl + Mouse click.
Rate
Cost per resource unit.
Quantity
The total amount of units assigned of this resource.
Cost
Total cost of the resource.
Account
Email address, Google account or code of a resource.
Site
Resource location. A Google Maps icon appears to show the address.
Custom columns
Additional columns.
Dropdown menu
The resources menu is at the top of the resources panel and opens when clicked with the functions below.
Collapse
Collapses the selected summary resource. If you want to keep and share this view, save it manually.
Expand
Expands the selected summary resources. If you want to keep and share this view, save it manually.
Collapse level
Collapses all summary resources with a RBS level equal to the selected resource. If you want to keep and share this view, save it manually.
Collapse all
Collapses all summary resources. If you want to keep and share this view, save it manually.
Show all resources
Expands all summary resources and shows all hidden resources. If you want to keep and share this view, save it manually.
Filter assigned tasks
Shows in the Tasks table the selected resource assigned tasks only, including underlying tasks. Other tasks are collapsed.
Sort down > on column
Sorts selected resources downwards based on column.
Sort up > on column
Sorts selected resources upwards based on column.
Increase indent
Increases the RBS level of the selected resources if possible, e.g. 1.2 becomes 1.1.4.
Decrease indent
Decreases the RBS level of the selected resources if possible, e.g. 1.3.1 becomes 1.4.
Insert summary above
Inserts a summary resource above the selected resources and increases the WBS level of the selected resources. Adjust the name of the inserted summary as desired.
Insert rows above
Inserts above the selected rows as many empty rows as selected.
Insert rows below
Inserts below the selected rows as many empty rows as selected.
Erase rows
Erases the selected rows.
Delete rows
Deletes the selected rows.
Copy rows
Copies the selected rows onto the clipboard for further pasting.
Cut rows
Copies the selected rows onto the clipboard and then deletes them.
Paste rows
Inserts the clipboard at the selected row.
Paste options...
Opens a dialog to select what information to paste from the clipboard:
- per resource any added color, note, documents in Google Drive,
resources and links,
- custom columns from other schedule.
Level all resources...
Ensures that all assigned resources stay below their capacity by shifting tasks forward. In ProjectWork menu, item Settings under Resource leveling you can select what should be included in the leveling and where the result should be visible.
Clear all leveling
Shifts back all shifted tasks due to resource leveling. As a result resources may exceed their capacity, what can be seen as red in the Capacity chart.
Level selection...
Ensures that selected resources stay below their capacity by shifting out tasks.
Clear leveling selection
Clears shifts of tasks assigned to selected resource(s) due to assignment leveling.
Undo
Undoes the last change
Redo
Redoes the last change
Columns...
Opens a dialog, see Arrange columns.
Assign resources to a task
Column Resources in the Tasks table shows per task the resources from the Resources table assigned to this task. Resource names are divided with a semicolon (;). The assigned quantity per resource is mentioned between square brackets ([ ]).
For example: R1;R2[2] means
1x R1
2x R2
If a resource has an abbreviation it will be used. If a resource is not in to the Resources table yet, it will be added.
Assigning resources is done easier by selecting one or more resources in the Resources table and by Ctrl + Mouse click a task in the Tasks table. The assignment of a work Type resource is done with a quantity equal to the Capacity, otherwise with a quantity of one. The quantity can be changed afterwards in the Resources column of the Tasks table.
Resource types
In the Resources table every resource has a type indication in the Type column. It affects how costs per resource are calculated per task based on its assignment and Rate.
| Work | Assigned per quantity and calculated per Work hour.
A full-time resource has a quantity of 1 (=100%). A part-time resource has a quantity of less than 1. A generic resource ('engineer') can have a quantity of more than 1. The resource cost per task is calculated by multiplying the assigned quantity, total work hours and price per work hour. |
| Equipment | Assigned per quantity and calculated per Duration hour.
The resource cost per task is calculated by multiplying task duration, the assigned quantity and price per hour. |
| Material | Assigned per quantity to task.
The optional Unit can be for instance 'meter'.
The resource cost per task is calculated by multiplying the number of assigned units and the cost per unit. |
| Part | Assigned per quantity to task.
The optional Unit can be for instance a part number.
The cost calculation is the same as for Material resource. |
| Service | Assigned per quantity to task.
The cost calculation is the same as for Material resource. |
| Sprint | Assigned to (summary) tasks to filter and summarize these tasks.
A Sprint is a project in the Scrum framework.
The Tasks table contains Product Backlog items with underlying work.
To a sprint resource assigned items form a Sprint Backlog.
This type of resource accumulates costs, work hours and progress, but adds nothing to a task. |
| Owner | Assigned to (summary) tasks to filter and summarize these tasks.
This makes it possible to split costs across various owners.
This type of resource accumulates costs, work hours and progress, but adds nothing to a task. |
| Site | Assigned to (summary) tasks to filter and summarize these tasks.
This makes it possible to split costs per location.
A site resource shows the address in the Site column by clicking on the Google Maps icon.
This type of resource accumulates costs, work hours and progress, but adds nothing to a task. |
Capacity chart
The Capacity chart shows with an indication in time when a resource is active. For work resources the indication is a color relative to the set capacity:
- blue if less than 50%,
- red if more than 100%,
- green in between.
Other type of resources will be shown grey. The position of the indication depends on the timescale at the top. The timescale can zoom-in (+) and zoom-out (-) and the start date can be adjusted in a calendar.
When zoomed-in, the Capacity chart can be shifted with the scroll bar at the bottom. As an alternative the timescale can be shifted by "grabbing" with the mouse. With the mouse in the timescale, the left mouse button zooms-in and the right mouse button zooms-out.
Capacity dropdown menu
The capacity menu is at the top of the capacity panel and opens when clicked with the functions below.
Today
Sets the start date of the Capacity-chart equal to today.
Project start
Sets the start date of the Capacity-chart equal to the project start.
Entire project
Shows the project from start to finish date.
Scale as Gantt chart
Makes the Capacity scale equal to the Gantt scale.
To Gantt chart
Changes panel view to show Gantt chart.
To Gantt with scale as Capacity
Changes panel view to show Gantt chart with scale equal to Capacity chart.
Settings
This dialog is opened from the ProjectWork menu.
Language
| English | Nederlands |
If the desired language is not listed, it is possible to translate ProjectWork in the Google Chrome browser with Google Translate. To do this, click on the Google Translate icon in the address bar. The dialogs regarding purchasing and the tables with project data will not be translated.
Number format
| 1,000.00 | 1.000,00 | 1 000,00 |
Thousands and decimal separator in number.
Currency
Selected currency symbol is shown where applicable.
Currency position
Position relative to amount.
Date format
| dd-mm-yyyy | dd.mm.yyyy | dd/mm/yyyy | mm/dd/yyyy | yyyy-mm-dd | yyyy.mm.dd | yyyy/mm/dd |
Order and separator (./-) for day (dd), month (mm), year (yyyy).
Time format
| hh:mm | am/pm |
24 hours or 12 hours.
Show time
Show only date or also time in table.
First day of week
Selection is visible in Gantt - and Capacity Diagram
Project summary (ID=0)
- Show project summary in Tasks table and Gantt chart.
- Show project summary in Resources table and Capacity chart.
Critical path indication
- Indicate tasks in critical path in Start and Finish date columns with red.
- Indicate tasks and links in critical path in Gantt chart with red.
- Indicate Slack column value in Gantt chart with dotted bar.
Progress indication
- Indicate progress color in column Progress in Tasks table.
- Indicate progress color in bar in Gantt chart.
Resource leveling
- Include/exclude tasks from the past in the leveling.
- Include/exclude completed tasks in the leveling.
- Indicate shifted task in the Tasks table.
- Indicate shifted task in the Gantt chart.
Uncertainty simulation
- Indicate 20%-50%-80% confidence in task finish dates in Gantt chart.
Default condition
| As soon as possible | As late as possible | Start on date | Finish on date |
Default condition for new task.
Default constant
| Resource | Work | Duration |
Default constant for new task.
Google Drive
Google Drive is an online storage service. ProjectWork saves schedule file edits automatically in the Google Drive of the user after each schedule change made. A simultaneous user of the same file will also see the change. To avoid disturbance between users of the same schedule file, changes in the view of the schedule are not saved automatically. Changes in view can be saved manually when needed and a simultaneous user of the same file will then see the changed view. To gain access to Google Drive, the user must give a one-time permission to ProjectWork if requested. Stored ProjectWork files can be opened from the ProjectWork app or from the Google Drive website.
Start a new project in Google Drive
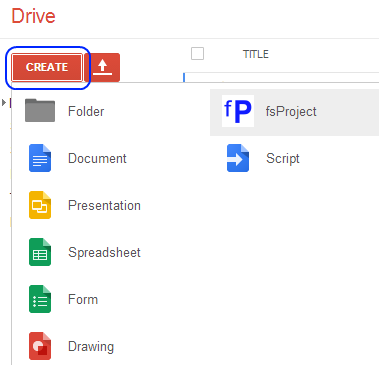
A new ProjectWork file can be created and opened by pressing the Create button in Google Drive and selecting ProjectWork as application.
Open existing project in Google Drive
An existing file can be opened in ProjectWork by double clicking on a ProjectWork file or by right-clicking on a file and selecting Open with... > ProjectWork.
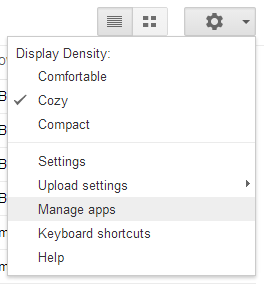
Setting ProjectWork as the standard application for .json files can be achieved in the settings menu (gear icon) under Manage apps.
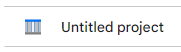
The ProjectWork icon appears in front of the file name and ProjectWork opens with this file.
Collaboration
With ProjectWork a team can collaborate on a shared project schedule. When they do this at the same time, they see each others changes in real-time. The number of participants is indicated before the file name in the ProjectWork panel. To know where the modification took place there is the option to mark this. This option is default on.
Collaboration on a schedule can start after following steps in Google Drive:
- Create a new ProjectWork schedule or use an existing one
- Select the file in Google Drive and right click to go to Share in the context menu
- Add participants and their access rights (view/edit) in the Share popup
- The participating accounts open the file in their 'Shared with me' folder in Google Drive
A user without a trial period or license, or with an expired trial period or license can open a personal or shared schedule for viewing. Edits to a shared schedule are not immediately visible, only after reloading.
Apps integration
ProjectWork has functions that provide information to other apps. To gain access to these apps, the user must give a one-time permission to ProjectWork if requested.
Post chat message
This dialog is opened from the ProjectWork menu.
You create a webhook URL once for a Google Chat space or Slack channel and save it via this dialog. A link to the opened planning is added per message. You can specify the view of this planning so that when you open the link in the posted message, this view is shown. You can also add information, such as the project description, to the message. Finally, you write a text and post the message in the Google Chat space or the Slack channel.
The text can be formatted: *bold*, _italics_ and <link> or <link|text>.
Publish schedule as HTML
This dialog is opened from the ProjectWork menu.
The published HTML code exactly matches the task table and the Gantt chart: collapsed tasks and hidden columns are not published. The Gantt chart is published as it is visible, including any zoom and scroll.
The HTML code is visible as a preview in the browser and as code to be embedded in a website, for example in Google Sites. The HTML code can also be stored in Google Drive.
See example.
Publish schedule in Google Sheets
This dialog is opened from the ProjectWork menu.
The schedule can be published as a new spreadsheet or as an update to a previously published spreadsheet. The spreadsheet consists of two worksheets: Tasks and Resources. The Tasks worksheet features a Gantt chart on the right side. Above the header row is room to add custom text or calculations.
The order of columns can be changed and columns can be hidden or deleted. Deleted columns are not added again with an update. Custom columns can be inserted containing information or cell formulas that use the planning data. You can also add custom worksheets with diagrams that use the planning data.
An update synchronizes the spreadsheet data with the tasks in the schedule. Added formatting to the spreadsheet, such as colors, and added comments are retained. The Gantt chart, dependent columns, calculations and charts are updated. For example, the update enables reporting on the current schedule, such as a comparison with the baseline schedule, see Frequently asked questions.
Publish milestones in Google Calendar
This dialog is opened from the ProjectWork menu under Publish.
A milestone is a task in the schedule with a duration of 0. Published milestones appear in private calendar 'ProjectWork' of the signed in Google account. This calendar may contain milestones of other published ProjectWork schedules of the same account.
Resource(s) assigned to a milestone which have their Account filled-in in the Resources table will get this milestone in their Google calendar(s).
Changes to milestones in the schedule are updated in the 'ProjectWork' calendar and in the calendars of resources with a Google account when your re-publish.
See example.
Publish sites in Google Maps
This dialog is opened from the ProjectWork menu under Publish. Publishing results in a link to a dynamic map showing the locations of resources. By clicking on the location, information about the associated resource appears, costs and notes are optional when published.
The link can be posted on a site or e-mailed. Re-publication gives the same link, but with the latest information. The link can also be removed.
See example.
Report in dashboard
This dialog is opened from the ProjectWork menu.
The dashboard is a common spreadsheet to track all projects. The projects are listed row by row with information and status per column. For each project there is a bar on the right of the same row from start to end date with the progress. You can insert joint columns for additional information and statistics. Each project updates the information itself. You can insert this spreadsheet into a Google site.
You start reporting by selecting a spreadsheet that has already been created as a dashboard using the Select button or you first create a new dashboard with the New button. In both cases, the dashboard is saved and shown as a link. With the link you open the spreadsheet with the dashboard. With the Update button you update the dashboard with the latest information. The account that updates the project and the moment when is listed with the project.
Selecting a dashboard is only possible if the dashboard is shared with your account. A project added to a selected dashboard is added below the present projects. You can change the order by dragging a row with a project. A project that no longer needs to be in a dashboard can be removed from the spreadsheet.
The dashboard spreadsheet can be adjusted to your liking. Columns can be removed without coming back after updating. Column headers can be adjusted, the order of columns can be changed. Formatting is retained after updating the data.